► Japanese
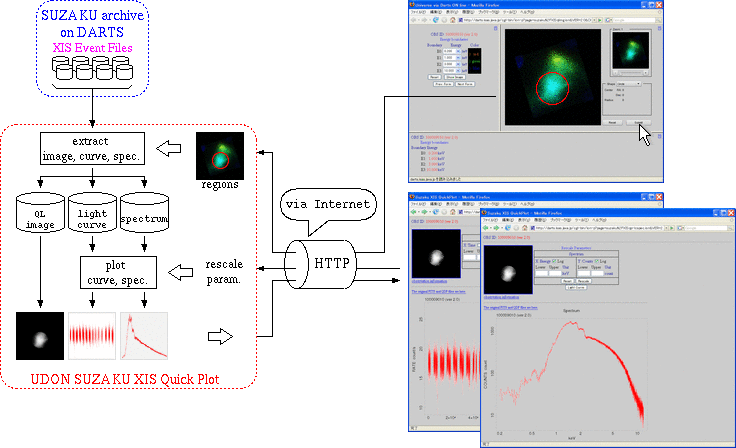
UDON
(Universe via Darts ON-line)
is the system to quickly analyze science satellite data archived in
DARTS
(Data Archives and Transmission System)
via Internet (HTTP).
With UDON, you can analyze DARTS archival data using your browser without downloading data from DARTS!
SUZAKU XIS Quick Plot
is the web service to display pseudo-color X-ray images taken by SUZAKU
XIS(X-ray Imaging Spectrometer), and to extract light curves
and spectra for specified regions on the image.
First, specify the data range to create spectrum and light curve on the XIS Quick Look image.
You can re-generate spectrum/light curve changing the extraction region.

|
| Back | To the top of this page |
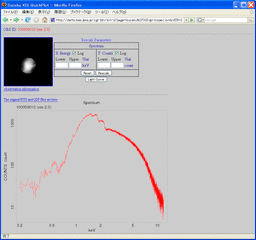
The initial screen is to display the spectrum .
The screen can be switched with the
Light curve button
and
Spectrum button
.
On the initial screen, you can see the spectrum
in the logarithmic scale.
On this screen you may re-display the
spectrum/light curve by changing the scale,
but you cannot specify the data extraction region.
If needed, please specify the data extraction region again
on the image generation screen of
UDON SUZAKU XIS Quick Look.
|
|
| Back | The top of this page | To the top of the screen guide |
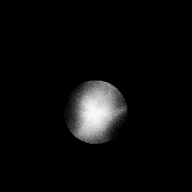 observation information |
| Back | To the top of this page | To the top of screen guide | To the top of this topic |
Display the extracted energy spectrum.
You can re-draw the graph if you change the scale or range.
Specify the graph scale and/or display range, and click [Rescale] button to re-draw the spectrum. Or click [Light Curve] button to switch from spectrum to light curve.
The original FITS and QDP files are here.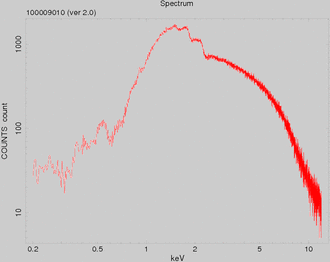
|
It is available to download the extracted spectrum data ( tar.gz file ) from " The original FITS and QDP files are here. " the link at upper side of the graph.
$ tar -ztvf 100009010v2_0-xissp.tar.gz
-rw-r--r-- apache/apache 182421 2008-07-28 15:26 100009010v2_0-xissp.fits.gz	# FITS file
-rw-r--r-- apache/apache    135 2008-07-28 15:26 100009010v2_0-xissp-pi.pco	# PI Channel
-rw-r--r-- apache/apache  27080 2008-07-28 15:26 100009010v2_0-xissp-pi.qdp	# PI Channel
-rw-r--r-- apache/apache    131 2008-07-28 15:26 100009010v2_0-xissp-ev.pco	# keV
-rw-r--r-- apache/apache  36225 2008-07-28 15:26 100009010v2_0-xissp-ev.qdp	# keV
$
$ mkdir PSR1509-58 $ tar -zxvf 100009010v2_0-xissp.tar.gz -C PSR1509-58 100009010v2_0-xissp.fits.gz 100009010v2_0-xissp-pi.pco 100009010v2_0-xissp-pi.qdp 100009010v2_0-xissp-ev.pco 100009010v2_0-xissp-ev.qdp $ |
| 100009010v2_0-xissp.fits.gz | FITS file | |
| 100009010v2_0-xissp-pi.pco | QDP command file | X-axis scale: PI Channel |
| 100009010v2_0-xissp-pi.qdp | QDP File | X-axis scale: PI Channel |
| 100009010v2_0-xissp-ev.pco | QDP command file | X-axis scale: keV |
| 100009010v2_0-xissp-ev.qdp | QDP file | X-axis scale: keV |
If there are any invalid input values when drawing the figure,
error messages are displayed.
Please input revised values, and draw the spectrum again.
| Sample error messages | Explanation |
|
Energy: Upper: -1.0: Specify a non-negative value. Counts: Lower: 1.o: Specify a non-negative value. |
You must input only positive value numerical values both for Lower and Upper. |
|
Energy: Upper: 0.200 is less than or equal to Lower: 1.000. Counts: Upper: 100 is less than or equal to Lower: 100. |
There is input failure that Lower limit = Upper limit,
or
Lower limit > Upper limit. The values should be always Lower < Upper. |
| Back | To the top of this page | To the top of the screen guide | To the top of the topics |
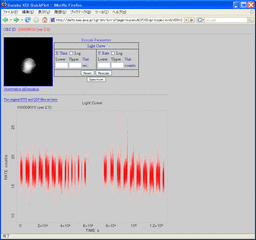
You can re-draw the graph by changing the scale and/or range.
Specify the graph scale and/or display range, and click [Rescale] button to re-draw the spectrum. Or click [Spectrum] button to switch from light curve to spectrum.
The original FITS and QDP files are here.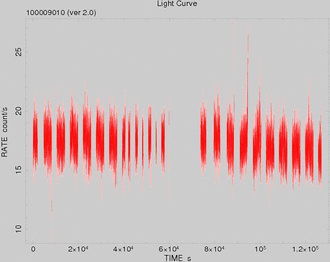
|
Please note that the graph will not appear if there is no data within the specified region.
The light curve data files may be downloaded from the link " tar.gz The original FITS and QDP files are here. " at upper side of the graph.
Save the light curve data
(FITS file and QDP file)
generated by data extraction
as
tar.gz
.
The FITS file and QDP file can be displayed
by
fplot ftool
and
qdp
command, respectively.
$ tar -ztvf 100009010v2_0-xislc.tar.gz
-rw-r--r-- apache/apache 26919 2008-07-28 15:26 100009010v2_0-xislc.fits.gz	# FITS file
-rw-r--r-- apache/apache   163 2008-07-28 15:26 100009010v2_0-xislc.pco		# QDP Command
-rw-r--r-- apache/apache 91490 2008-07-28 15:26 100009010v2_0-xislc.qdp		# QDP File
$
$ mkdir PSR1509-58 $ tar -zxvf 100009010v2_0-xislc.tar.gz -C PSR1509-58 100009010v2_0-xislc.fits.gz 100009010v2_0-xislc.pco 100009010v2_0-xislc.qdp $ |
| 100009010v2_0-xislc.fits.gz | FITS file | |
| 100009010v2_0-xislc.pco | QDP command file | |
| 100009010v2_0-xislc.qdp | QDP file |
Display error message if there are any input errors when drawing the figure.
Please correct the input values to re-display the figure.
| Error message sample | Explanation |
|
Time: Lower: -9000: Specify a non-negative value. Rate: Upper: 1,0000: Specify a non-negative value. |
Both Lower and Upper should be positive values. |
|
Time: Upper: 12000 is less than or equal to Lower: 70000. Rate: Upper: 15 is less than or equal to Lower: 20. |
Lower = Upper
or
Lower > Upper.
(Lower >= Upper)
Upper should be always greater than Lower (Lower < Upper). |
| Back | To the top of this page | To the top of the screen guide | To the top of the topic |