VSOP Survey Statistical Results
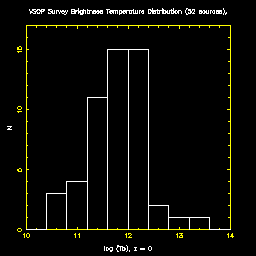
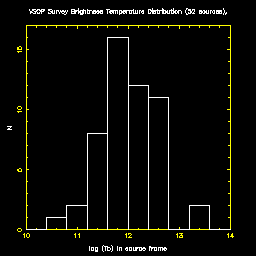
Survey Source Brightness Temperature Distribution
Data taken from submitted datasets where a modelfit has been attempted.
The highest brightness temperature component in these modelfits has been
plotted. Sources where a point source or a line has been fitted are not
shown as these represent a lower-limit on the brightness temperature. In
the case where more than one person had reduced the same dataset, the model
fit with the lowest brightness temperature was used.
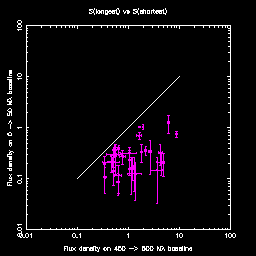
Flux vs Flux
The following plot shows the scalar averaged flux density over the (u,v)
radius range of 0 to 50 Mlambda plotted against mean flux density over
the 450 to 500 Mlambda baseline. The plot includes only the sources for
which data were collected on these baselines and experiments where the
analyst was able to model or image the data.


