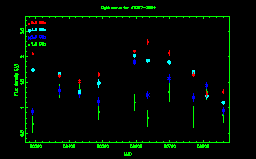
ATCA Flux Density Monitoring Data for J1037-2934
 |
ATCA Flux density light-curve. Click on the image
for the high resolution version.
The light-curve is also availlable as a postscript file
Light-curve Data
|
Epoch
|
1.384 GHz
|
2.368 GHz
|
4.800 GHz
|
8.640 GHz
|
|
(mmmyy)
|
(MJD) |
Flux Density (Jy)
|
Error (Jy)
|
Flux Density (Jy)
|
Error (Jy)
|
Flux Density (Jy)
|
Error (Jy)
|
Flux Density (Jy)
|
Error (Jy)
|
| Jul96 |
50291 |
0.6799 |
0.1530 |
0.9265 |
0.0637 |
1.7370 |
0.0181 |
2.0550 |
0.0209 |
| Oct96 |
50370 |
|
|
|
|
|
|
|
|
| Oct96 |
50371 |
1.3240 |
0.1280 |
1.3460 |
0.0792 |
1.6600 |
0.0177 |
1.6270 |
0.0293 |
| Dec96 |
50431 |
1.3610 |
0.1340 |
1.2770 |
0.0786 |
1.3090 |
0.0203 |
1.5140 |
0.0480 |
| Feb97 |
50488 |
0.9172 |
0.1490 |
1.1240 |
0.0739 |
1.4800 |
0.0736 |
1.6500 |
0.0468 |
| May97 |
50595 |
1.0990 |
0.1580 |
1.8970 |
0.0546 |
2.0170 |
0.0154 |
2.1080 |
0.0216 |
| Jul97 |
50635 |
0.7917 |
0.1480 |
1.2510 |
0.0691 |
1.9220 |
0.0313 |
2.2850 |
0.0474 |
| Sep97 |
50698 |
1.3130 |
0.1830 |
1.5780 |
0.0787 |
1.8900 |
0.0372 |
2.0710 |
0.0533 |
| Nov97 |
50771 |
0.8255 |
0.2020 |
1.2050 |
0.0785 |
1.6980 |
0.0350 |
1.6490 |
0.0386 |
| Dec97 |
50811 |
1.3110 |
0.1470 |
1.4370 |
0.0623 |
1.2290 |
0.0382 |
1.2730 |
0.0487 |
| Feb98 |
50860 |
0.8580 |
0.1490 |
0.9433 |
0.0699 |
1.0980 |
0.0328 |
1.3140 |
0.0360 |
Last updated on Sat Jul 29 18:38:39 UTC 2006
by survey2html version 1.20

