ATCA Flux Density Monitoring Data for J1911-2006
 |
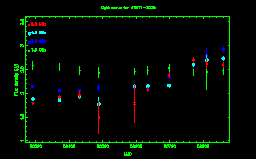
ATCA Flux density light-curve. Click on the image
for the high resolution version.
The light-curve is also availlable as a postscript file
Light-curve Data
|
Epoch
|
1.384 GHz
|
2.368 GHz
|
4.800 GHz
|
8.640 GHz
|
|
(mmmyy)
|
(MJD) |
Flux Density (Jy)
|
Error (Jy)
|
Flux Density (Jy)
|
Error (Jy)
|
Flux Density (Jy)
|
Error (Jy)
|
Flux Density (Jy)
|
Error (Jy)
|
| Jul96 |
50291 |
2.5860 |
0.0861 |
2.1430 |
0.0268 |
1.8770 |
0.0135 |
1.7930 |
0.0199 |
| Oct96 |
50370 |
|
|
|
|
|
|
|
|
| Oct96 |
50371 |
2.5490 |
0.0758 |
2.0520 |
0.0402 |
1.8580 |
0.0229 |
1.9270 |
0.0310 |
| Dec96 |
50431 |
2.4770 |
0.0753 |
2.0530 |
0.0337 |
1.9260 |
0.0237 |
1.9720 |
0.0580 |
| Feb97 |
50488 |
2.4290 |
0.1050 |
2.1220 |
0.0653 |
1.7690 |
0.1450 |
1.4910 |
0.3380 |
| May97 |
50595 |
2.4590 |
0.0696 |
2.1020 |
0.0470 |
2.1440 |
0.0222 |
1.7830 |
0.3870 |
| Jul97 |
50635 |
2.4790 |
0.0781 |
2.1230 |
0.0509 |
2.1490 |
0.0322 |
2.0770 |
0.0373 |
| Sep97 |
50698 |
2.5250 |
0.0836 |
2.3570 |
0.0528 |
2.1590 |
0.0327 |
2.3830 |
0.0455 |
| Nov97 |
50771 |
2.4480 |
0.0746 |
2.6110 |
0.0883 |
2.6020 |
0.0449 |
2.7040 |
0.0470 |
| Dec97 |
50811 |
2.4470 |
0.3590 |
2.7890 |
0.1420 |
2.6940 |
0.0929 |
2.6220 |
0.1050 |
| Feb98 |
50860 |
2.4760 |
0.0718 |
2.9280 |
0.0557 |
2.7330 |
0.0427 |
2.5970 |
0.0468 |
Last updated on Sat Jul 29 18:38:39 UTC 2006
by survey2html version 1.20

