Graph area
Line chart
Scatter diagram & Histogram
*Both graph have same features.
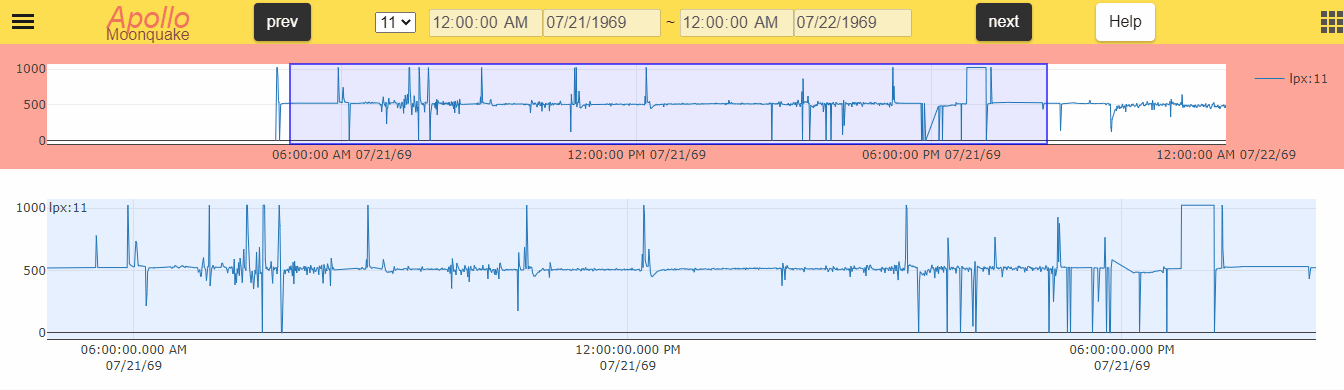
1. guide graph

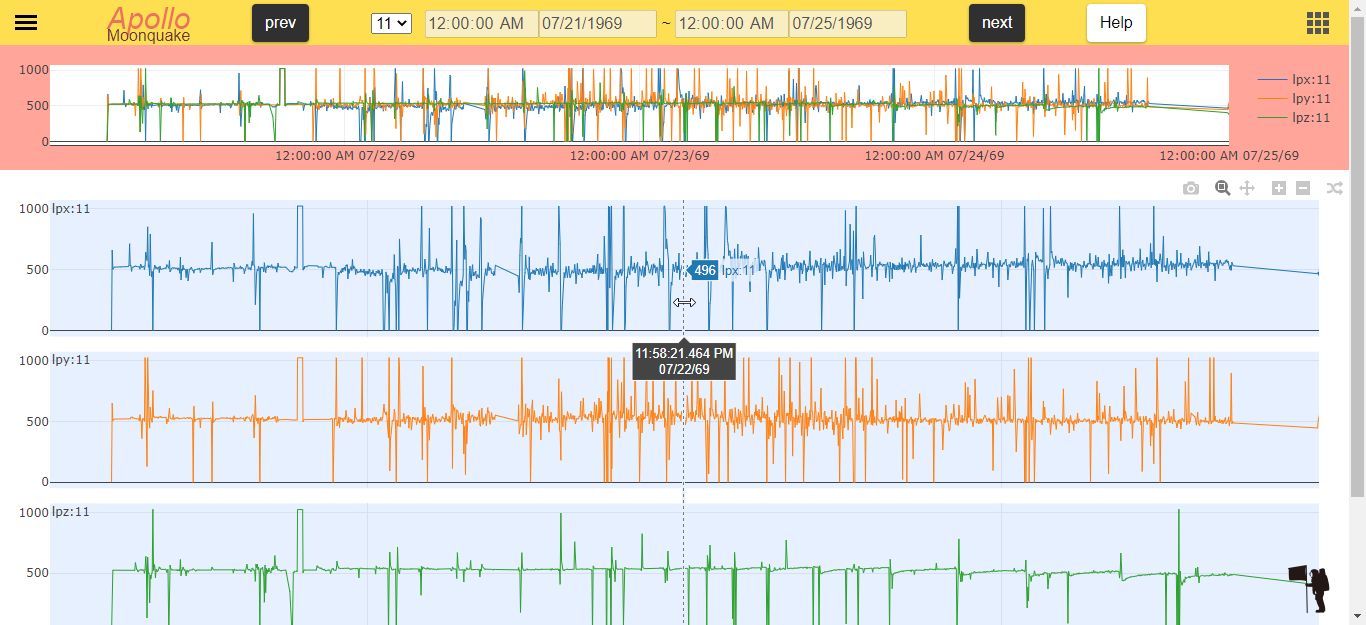
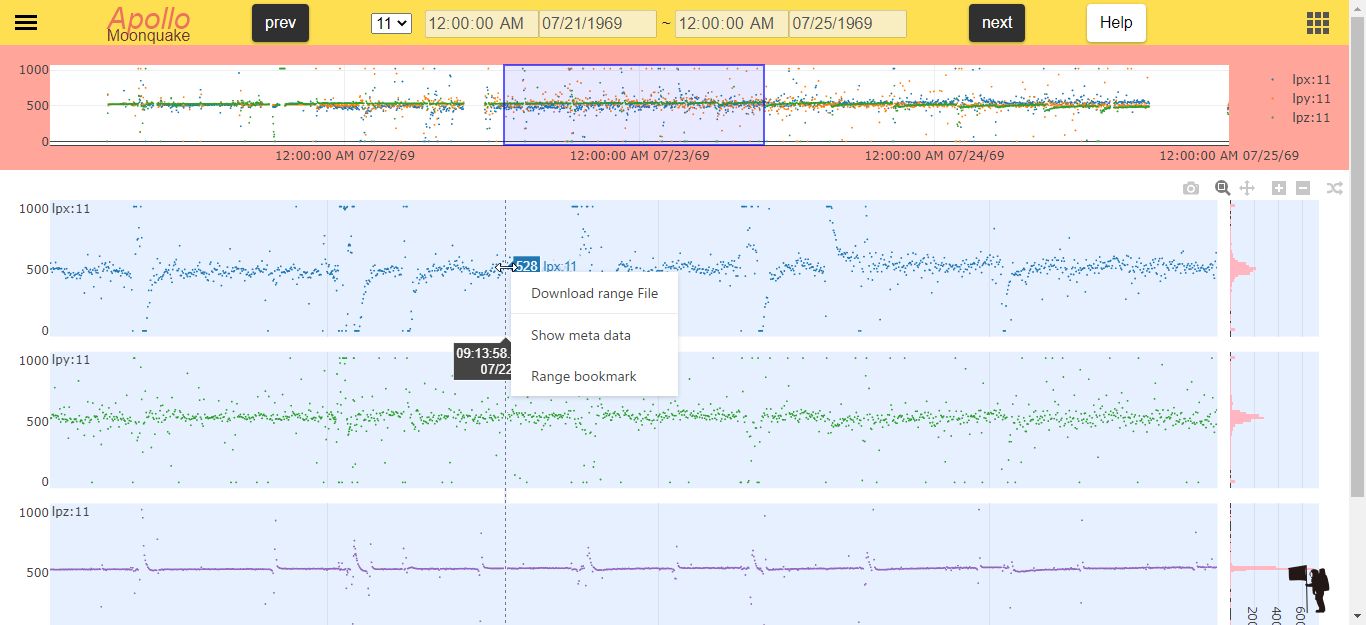
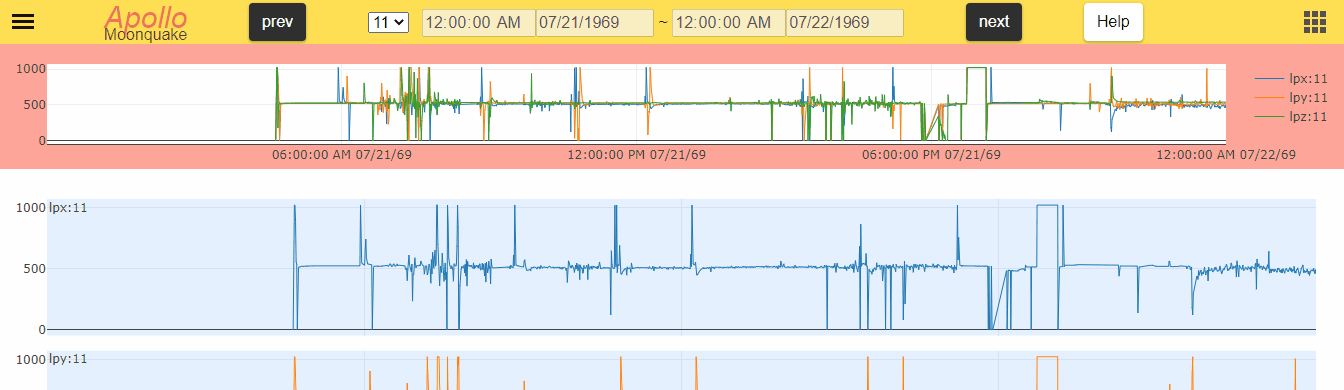
Click on the search button and after the data exists, the selected graph will be displayed here. The plotted graph is created based on the search information in the search bar, but there is only one Apollo data displayed. If you want to change to another Apollo data, change the Apollo number in the select box in the header. See header page for how to change Apollo data. In this area, you can move the guide graph by dragging the X-axis, change the search period by dragging the X-axis, and perform a more detailed search (called range search). However, there is a limit of three months for the search range. You can also right-click to use functions such as range bookmarking. For more details, please refer to 5. download range file , 6. meta data, 7. range bookmark.
Move the guide graph

Change the search period
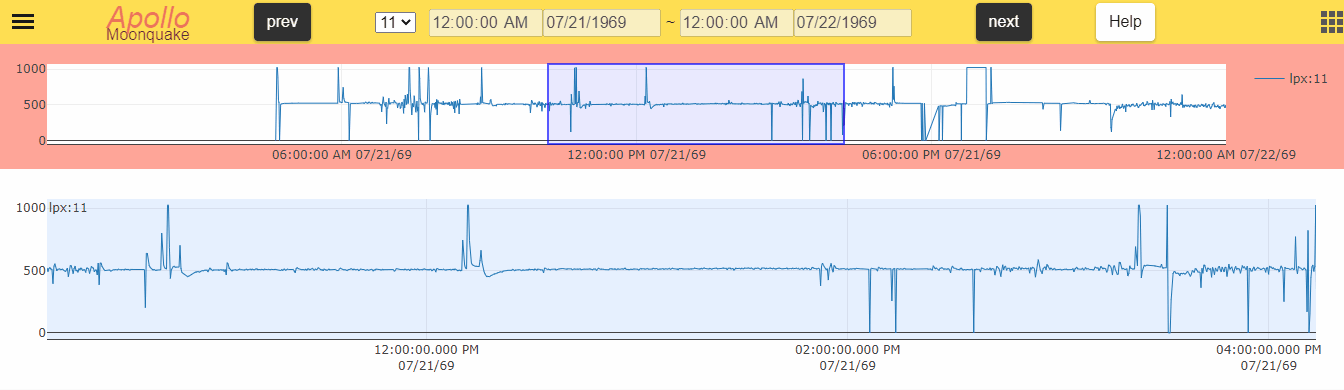
2. main graph
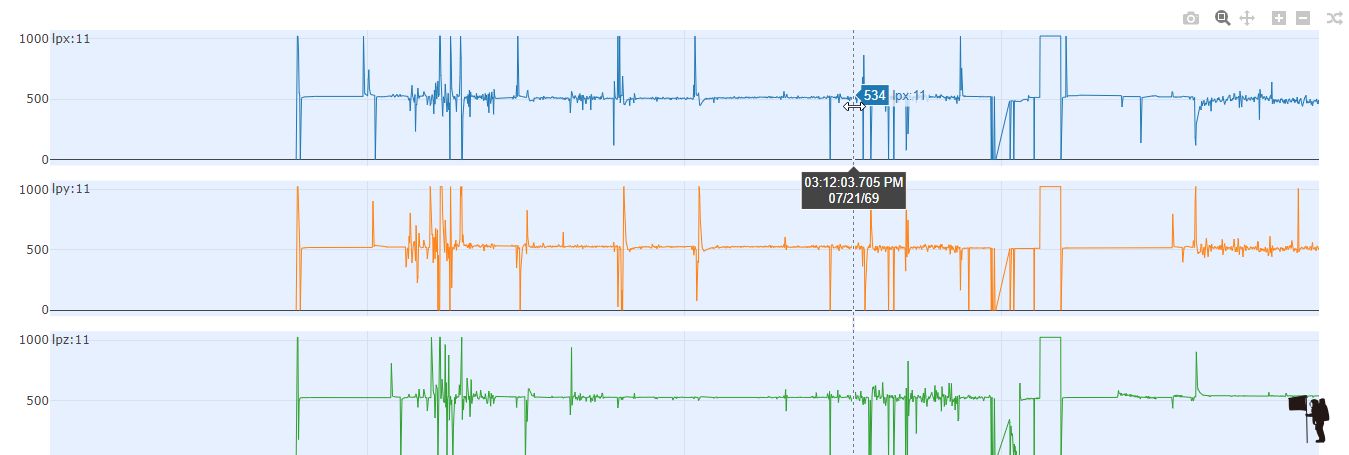
Click the search button, and if the data exists, all graphs will be displayed here. In this area, you can move the main graph by dragging the X-axis, or change the search period by dragging the X-axis. However, you cannot go beyond the search range of the guide graph. You can change the function by changing the mode in the toolbar. Some functions, such as range bookmarks, can be used by right-clicking. Please refer to 5. download range file, 6. meta data, 7. range bookmark.
Move main graph
Change the search period
3. range search

This function can be used after the guide graph has been drawn. If you want to get detailed data, drag on the guide graph to select it. The main graph will change within the area you dragged. If you move the guide graph, the selected range will disappear.
Range search

4. toolbar

These features, from left to right, are "Download plot as a png", "Zoom", "Pan", "Zoom in", "Zoom out" and "Change plot mode". Refer to the following table for feature description.
| feature | description |
|---|---|
| Download plot as a png | Downloaded png has all plot you searched and displayed on main graph. Change the search information if you want to get specific graph. |
| Zoom | It zooms the range you dragged on main graph. |
| Pan | It moves the range you dragged on main graph. Please, don't move while the Moon is spinning because access may fail. |
| Zoom in | It halves the range of main graph. |
| Zoom out | It doubles the range of main graph. |
| Change plot mode | It changes Line chart and Scatter diagram & Histogram |
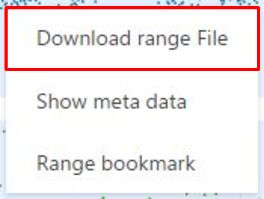
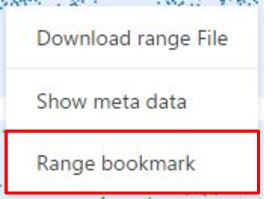
5. download range file
This is the menu that appears when you right-click on the guide or the main graph. You will need to do a range search beforehand, as it will use the range searched period. Click on the button to display the modal. By selecting the rejection condition on the modal, you can eliminate the error data. For details on how to download the software, please see the detail bar page.
6. meta data
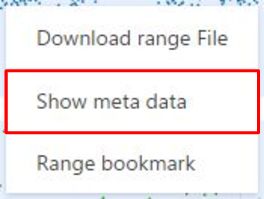
This is the menu that appears when you right-click on the guide or the main graph. It will jump to a page with detailed metadata. This jumped page is based on the point where you right-clicked, so please right-click while viewing the graph information.
7. range bookmark
This is the menu that appears when you right-click on the guide or the main graph. Before using this function, try the range search and check the items in the search bar.
8. top button

Go to the top. It can also assist you while searching.