XRT/XIS: Vignetting
Calibration status and caveats
- Vignetting inside the FOV
Based on a series of observations of the Crab Nebula, we investigated the vignetting of the four XRT modules in two energy bands, 3-6 keV and 8-10 keV (energies below 3keV was not used because the uncertainty becomes larger due to the decrease of the low-energy efficiency). Figure 1 compares the vignetting curves calculated by the ray-tracing simulator and the observed intensities of the Crab Nebula at various off-axis positions. The result shows that the effective area was calibrated to within ~10% over the XIS field of view. Note that the statisitical error associated with each measurement is smaller than the systematic error and typically 4% in the 3-6keV band and 6% in the 8-10 keV band. The calibration uncertainty may become larger outside this energy range, especially below 0.3 keV (BI chip) and above 10 keV. See Suzaku memo 2006-34 for details.
Note that as shown in Figure 2, positions of the optical axes (at which the vignetting curves in Figure 1 show the maximum) scatter around the origin on the DETX-DETY plane, but they are within ~1'.

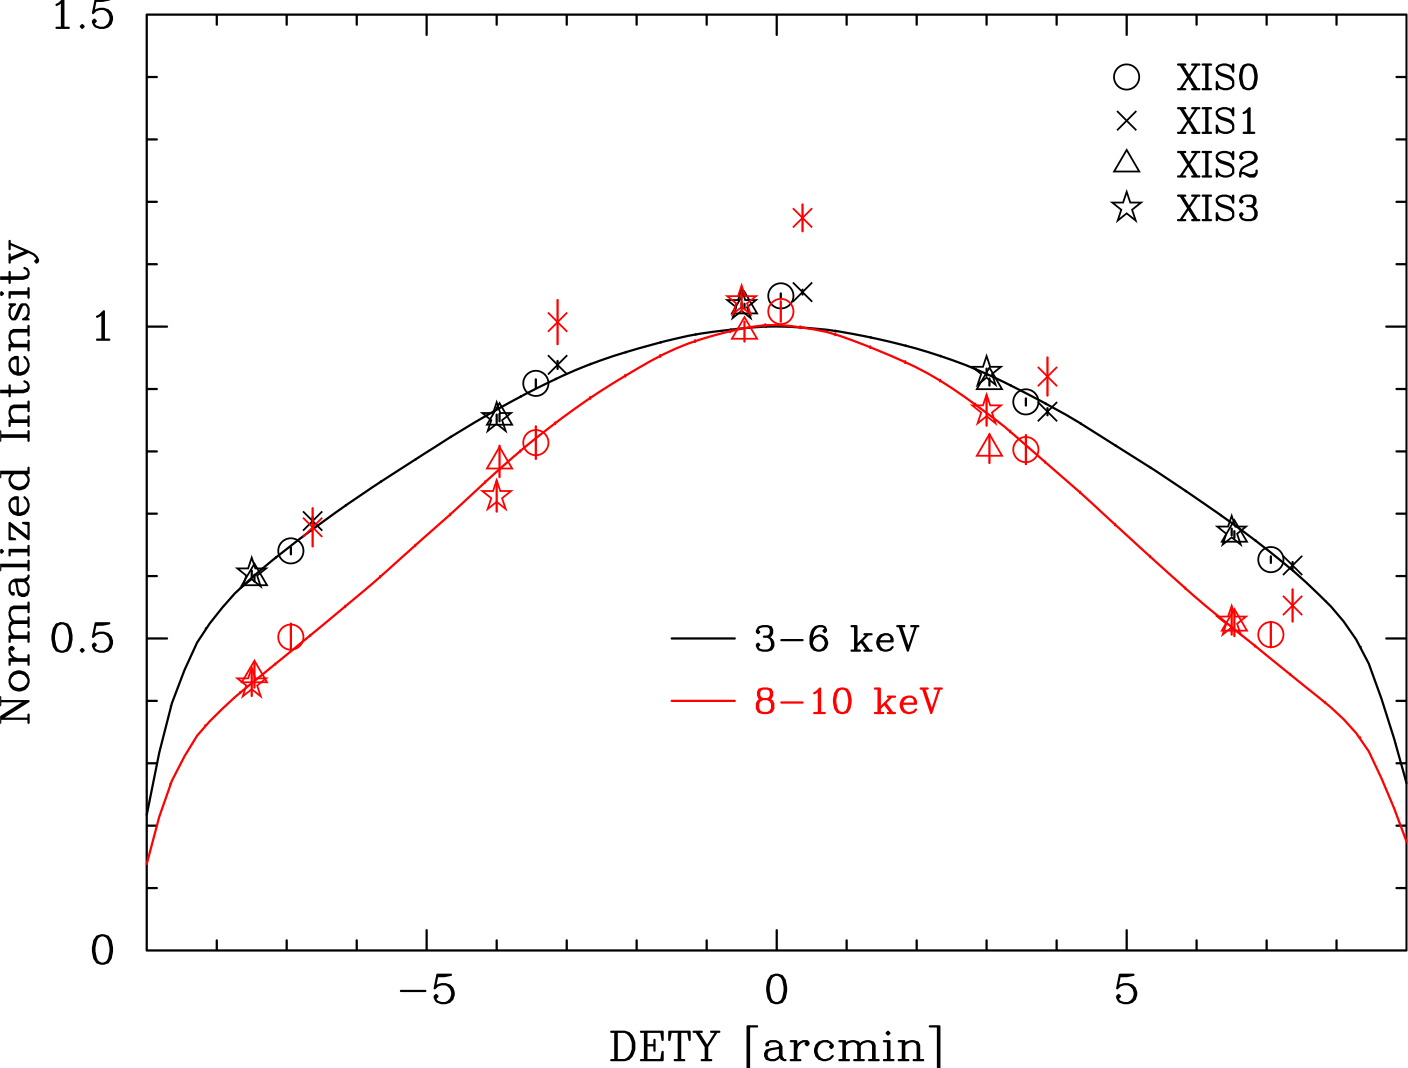
Figure 1: Vignetting of the four XRT modules using the Crab Nebula taken during 2005 August 22-27. The model curves were calculated with ray-tracing simulator with spectral parameters of NH=0.33e22 cm-2, a photon index of 2.09 and normalization of 9.845 photons cm-2 s-1 keV-1.
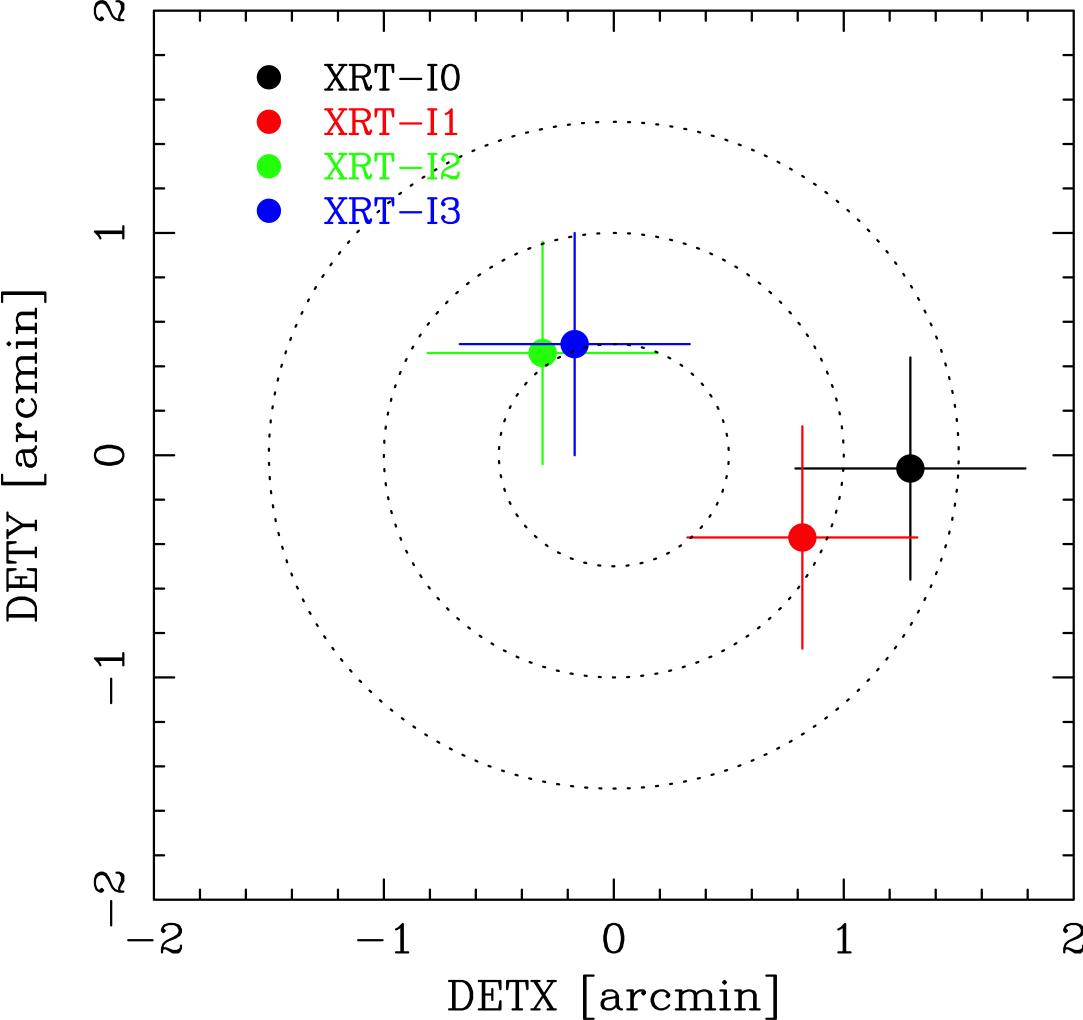
Figure 2: Locations of the optical axis of each XRT module in the focal plane determined from the observations of the Crab Nebula in 2005 August-September. This figure implies that the image on each XIS detector becomes brightest when a target star is placed at the position of the corresponding cross. The dotted circles are drawn every 30'' in radius from the XIS-default position.
- Stray light
The presence of nearby bright sources outside the FOV would produce 'ghost' images on the focal plane, called "stray light", and may contaminate your observation. However the effect has been largely reduced thanks to the introduction of the pre-collimeter system for the Suzaku XRT compared with its predecessor, ASCA, and is about 1/1000 at the off-axis angle of 10' (see Figure 3).
The calibration of the inflight stray light was carried out with Crab at off-axis angles of 20', 50', and 120' in 2005-August and 2005-September. Figure 3 shows the angular responses of the XRT, where the effective area was evaluated by integrating the image over the entire FOV of the XIS sensors (i.e., 17'.8 x 17'.8) because the image pattern is usually so complex. The simulated curve and the inflight data shows an agreement within one order at any energy. The present uncertainties for some radial ranges are summarized in Table 1. See also Sec 5.2.6 of the technical description.


Figure 3: Angular responses of the XRT at 1.5 keV (left) and 4.5 keV (right) up to 2 degrees. The effective area is normalized at on-axis. The three curves represent different parameters of the ray-tracing program and the black one is currently implemented in the arf generator. The crosses are the results of the Crab pointing observations.
Table 1: Present uncertainties of angular responses Energy Off-axis angle<20' 30'-70' >70' <1.5 keV +100% -100%
+0% -1000%
N.A. >1.5 keV +100% -100%
+2000% -0%
N.A.
Related links
- Suzaku memo 2006-34 "The X-ray Telescope onboard Suzaku"
- The Suzaku technical description Sec.5.2.6 "Stray light"
Last Modified: 12-July-2007