► Japanese
UDON2 Quick Plot Help Page
Contents
- 1. What is UDON2 Quick Plot
- 2. How to display spectrum/light curve?
- 3. Switching between spectrum and light curve display
- 4. What you can do with UDON2 Quick Plot
1. What is UDON2 Quick Plot?
UDON2 Quick Plot is the web service to extract light curves and spectra
for specified regions on the UDON2 QuickLook Image.
 |
2. How to display spectrum/light curve?
First, specify the data range to create spectrum and light curve on the UDON2 QuickLook image.
- Access UDON2 QuickLook to generate
pseudo-color image.
Steps to generate the pseudo-color image are here.
- Specify the region to generate spectrum and
light curve.
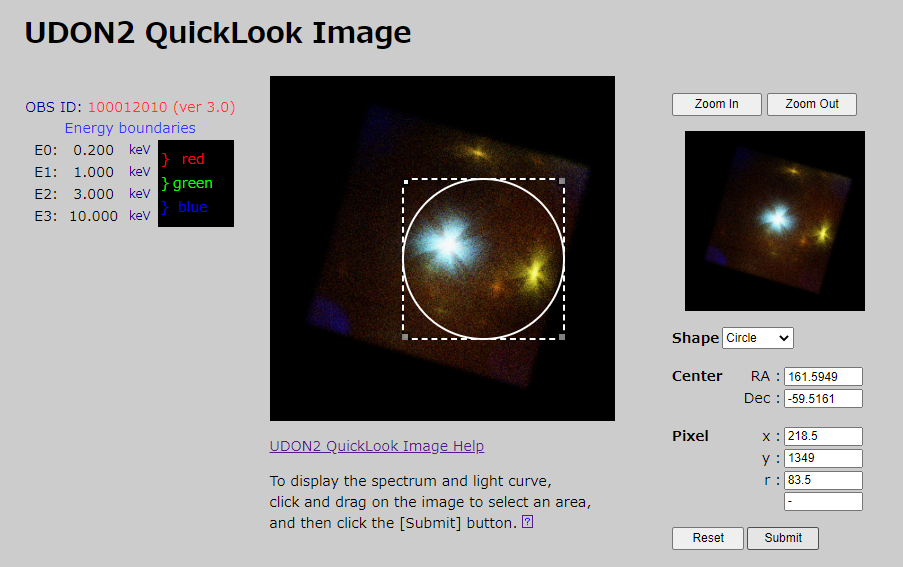
- Click the [Submit] button to display the
spectrum and light curve.
It may take several minutes to extract a spectrum and light curve for bright sources. Please be patient...
Please note that the graph will not appear if there is no data within the specified region.
3. Switching between spectrum and light curve display
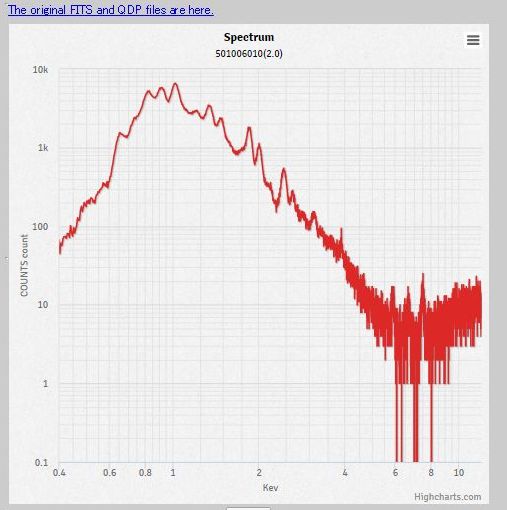
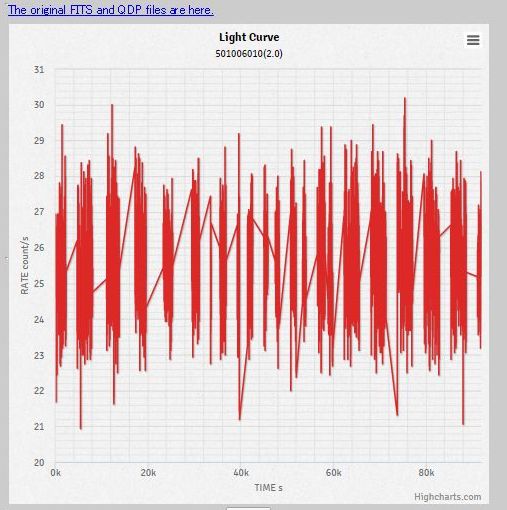
The initial screen is to display the spectrum. The screen can be switched with the Light curve button and Spectrum button .
On the initial screen, you can see the spectrum in the logarithmic scale.
|
|
4. What you can do with UDON2 Quick Plot
-
4.1. Check the image of the data extraction region and the result of the data extraction process.
-
4.2. Change the display range of spectrum/light curve - Pat1: with scale input
-
4.3. Change the display range of spectrum/light curve - Pat2: with mouse
-
4.4. Download the data
4.1. Check the image of the data extraction region and the result of the extraction process.
 observation information |
Click the image, then results of the data extraction process (extractor command-line and screen output) are displayed.
Clicking the string under the image, "observation information" will display some information about the observation (taken from the FITS Primary Header).
To go back to the previous page, please use the [Back] button of your browser, or the [Back] button on the upper-right corner of the page.
Go to top of "4. What you can do with UDON2 Quick Plot"⏶ | Go to TOP of this page⏏
4.2. Change the display range of spectrum/light curve - Pat1: with scale input
You can re-draw the graph if you change the scale or range.
On this screen you may re-display the spectrum/light curve
by changing the scale, but you cannot specify the data extraction region..
If needed, please specify the data extraction region again on the UDON2 QuickLook Image.
Scale Input Form of sprctrum
Specify the graph scale and/or display range, and click [Rescale] button to re-draw the spectrum. Or click [Light Curve] button to switch from spectrum to light curve.
Scale Input Form of light curve
Specify the graph scale and/or display range, and click [Rescale] button to re-draw the spectrum. Or click [Spectrum] button to switch from light curve to spectrum.
Errors in scale input
If there are any invalid input values when drawing the figure, error
messages are displayed.
Please input revised values, and draw
the spectrum again.
| Sample error messages | Explanation |
| Energy: Upper: -1.0: Specify
a non-negative value. Counts: Lower: 1.o: Specify a non-negative value. |
You must input only positive value numerical values both for Lower and Upper. |
| Energy: Upper: 0.200
is less than or equal to Lower: 1.000. Counts: Upper: 100 is less than or equal to Lower: 100. |
There is input failure that Lower limit = Upper
limit, or Lower limit > Upper limit. The values should be always Lower < Upper. |
| Error message sample | Explanation |
| Time: Lower: -9000: Specify
a non-negative value. Rate: Upper: 1,0000: Specify a non-negative value. |
Both Lower and Upper should be positive values. |
| Time: Upper: 12000
is less than or equal to Lower: 70000. Rate: Upper: 15 is less than or equal to Lower: 20. |
Lower = Upper or Lower > Upper. (Lower >=
Upper) Upper should be always greater than Lower (Lower < Upper). |
Go to top of "4. What you can do with UDON2 Quick Plot"⏶ | Go to TOP of this page⏏
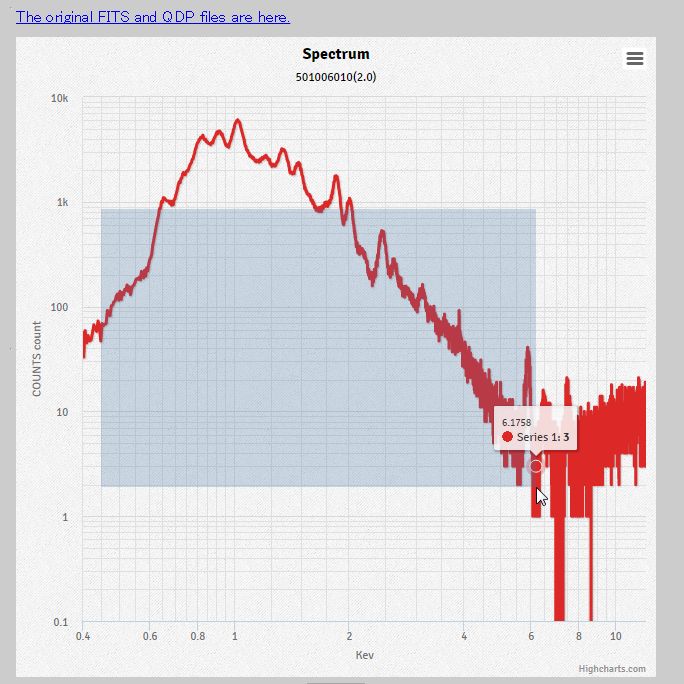
4.3. Change the display range of spectrum/light curve - Pat2: with mouse
Please understand that in some cases, the graph may not appear if there is no data within the region which you specified.It is available to download the extracted spectrum data ( tar.gz file ) from "The original FITS and QDP files are here." the link at upper side of the graph.
Reduced size graph.
 |
|
 |
|||
 |
|
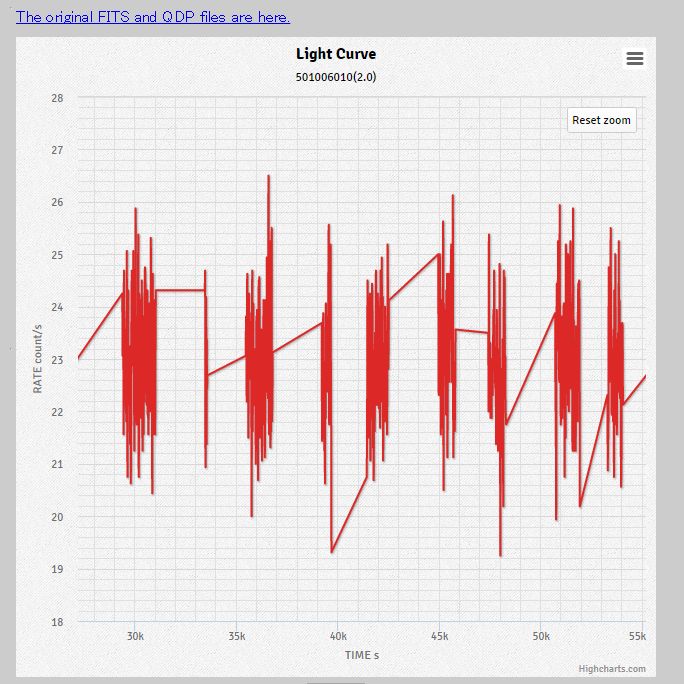 |
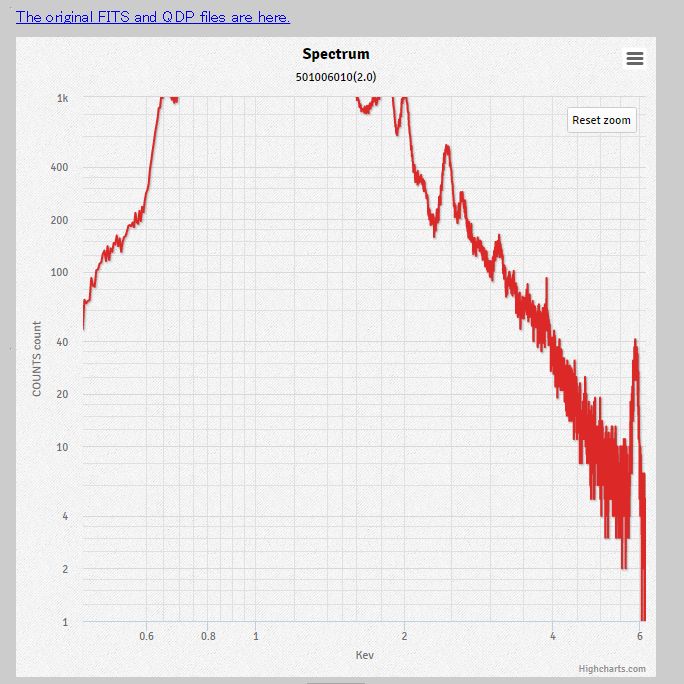
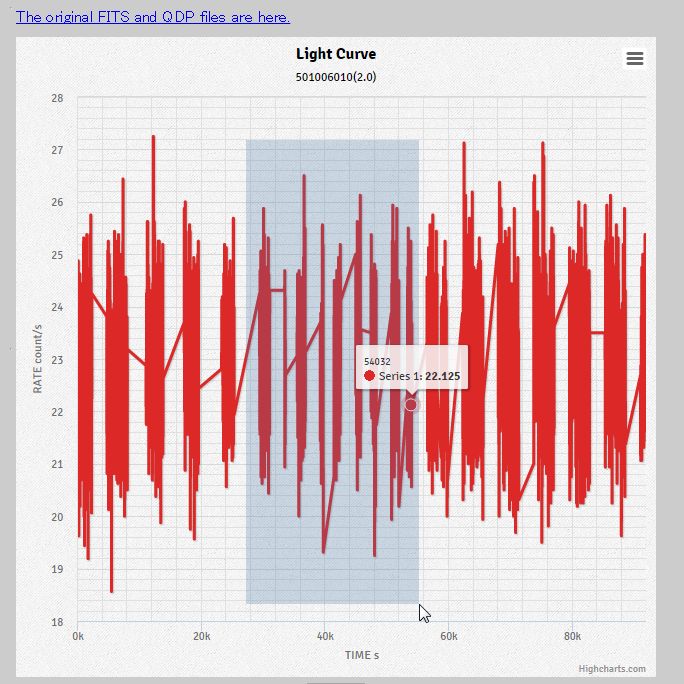
You can zoom-in a part of the graph by specifying the region with mouse.
Go to top of "4. What you can do with UDON2 Quick Plot"⏶ | Go to TOP of this page⏏
4.4 Download the data
 |
 |
Save extracted spectrum/light curve data (FITS file and QDP file) may be downloaded from the link " The original FITS and QDP files are here." at upper side of the graph. After downloading the files, you can display them by fplot ftool or qdp command.
However, this data is a spectrum or light curve created by extracting data from the region selected on UDON2 QuickLook Image. It is not the data that re-displayed by changing the scale or selected mouse on the UDON2 Quick Plot screen.
Thesedata are packaged as tar.gz file.
$ tar -ztvf 100009010v2_0-xissp.tar.gz
-rw-r--r-- apache/apache 182421 2008-07-28 15:26 100009010v2_0-xissp.fits.gz  # FITS file
-rw-r--r-- apache/apache  135 2008-07-28 15:26 100009010v2_0-xissp-pi.pco  # PI Channel
-rw-r--r-- apache/apache 27080 2008-07-28 15:26 100009010v2_0-xissp-pi.qdp  # PI Channel
-rw-r--r-- apache/apache  131 2008-07-28 15:26 100009010v2_0-xissp-ev.pco  # keV
-rw-r--r-- apache/apache 36225 2008-07-28 15:26 100009010v2_0-xissp-ev.qdp  # keV
$
$ mkdir PSR1509-58 $ tar -zxvf 100009010v2_0-xissp.tar.gz -C PSR1509-58 100009010v2_0-xissp.fits.gz 100009010v2_0-xissp-pi.pco 100009010v2_0-xissp-pi.qdp 100009010v2_0-xissp-ev.pco 100009010v2_0-xissp-ev.qdp $ |
| 100009010v2_0-xissp.fits.gz | FITS file | |
| 100009010v2_0-xissp-pi.pco | QDP command file | X-axis scale: PI Channel |
| 100009010v2_0-xissp-pi.qdp | QDP File | X-axis scale: PI Channel |
| 100009010v2_0-xissp-ev.pco | QDP command file | X-axis scale: keV |
| 100009010v2_0-xissp-ev.qdp | QDP file | X-axis scale: keV |
$ tar -ztvf 100009010v2_0-xislc.tar.gz
-rw-r--r-- apache/apache 26919 2008-07-28 15:26 100009010v2_0-xislc.fits.gz  # FITS file
-rw-r--r-- apache/apache  163 2008-07-28 15:26 100009010v2_0-xislc.pco    # QDP Command
-rw-r--r-- apache/apache 91490 2008-07-28 15:26 100009010v2_0-xislc.qdp    # QDP File
$
$ mkdir PSR1509-58 $ tar -zxvf 100009010v2_0-xislc.tar.gz -C PSR1509-58 100009010v2_0-xislc.fits.gz 100009010v2_0-xislc.pco 100009010v2_0-xislc.qdp $ |
| 100009010v2_0-xislc.fits.gz | FITS file | |
| 100009010v2_0-xislc.pco | QDP command file | |
| 100009010v2_0-xislc.qdp | QDP file |
Go to top of "4. What you can do with UDON2 Quick Plot"⏶ | Go to TOP of this page⏏